What is CAGR? How to Calculate Compound Annual Growth Rate
Learn what CAGR (Compound Annual Growth Rate) means, how to calculate it, and why it matters for investments. Includes formula, examples, and comparison with simple returns.
Software Developer · Creator of calculox.in · Formulas verified per RBI, Finance Act 2025-26 & SEBI
Learn about my expertise →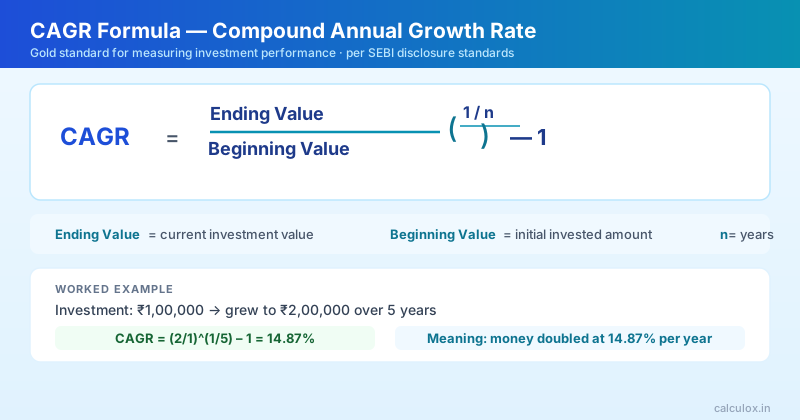
Try it yourself →
Use our free CAGR Calculator for instant results
Approximate long-run CAGR by asset class in India — ₹1 lakh invested, 10-year horizon
| Asset Class | Typical CAGR | ₹1L grows to (10 years) | Risk Level |
|---|---|---|---|
| Savings Account | 3 – 4% | ₹1.34 – 1.48 lakh | Very Low |
| Bank FD (5-year) | 6 – 7% | ₹1.79 – 1.97 lakh | Low |
| PPF | 7.1% | ₹1.99 lakh | Very Low |
| Gold | 9 – 11% | ₹2.37 – 2.84 lakh | Medium |
| Nifty 50 (large-cap) | 11 – 13% | ₹2.84 – 3.39 lakh | High |
| Mid-cap Index | 13 – 15% | ₹3.39 – 4.05 lakh | Very High |
What is CAGR?
CAGR (Compound Annual Growth Rate) represents the mean annual growth rate of an investment over a specified time period, assuming profits are reinvested at the end of each year. It is the most common metric used to compare investment performance and business growth. Unlike simple returns, CAGR smooths out the volatility of year-by-year returns to show a consistent annual growth rate.
The CAGR Formula
CAGR = (Ending Value / Beginning Value)^(1/n) – 1. Where n = Number of years. Example: You invested ₹1,00,000 in a mutual fund. After 5 years, it grew to ₹1,76,234. CAGR = (1,76,234 / 1,00,000)^(1/5) – 1 = (1.76234)^0.2 – 1 = 1.12 – 1 = 0.12 = 12% CAGR. This means your investment grew at a compounded rate of 12% per year.
CAGR vs Absolute Return vs Simple Interest
Absolute Return: Total % gain/loss ignoring time. Example: ₹1L → ₹2L = 100% absolute return (but over how long?). Simple Return/CAGR: 100% over 10 years = 7.18% CAGR (much less impressive!). 100% over 3 years = 26% CAGR (much better!). CAGR is always better for comparing investments of different durations.
Where CAGR is Used in Finance
Mutual fund performance: 1-year, 3-year, 5-year CAGR shown in fund fact sheets. Stock market returns: Nifty 50 has delivered ~14-15% CAGR over the last 20 years. Business revenue growth: Companies report revenue CAGR in annual reports. Real estate: Property value CAGR helps compare with other investments. FD vs equity: Comparing 6% FD with 12% equity CAGR over 10 years.
CAGR Limitations
While CAGR is powerful, it has limitations: It assumes smooth, consistent growth (real investments fluctuate). It does not show risk or volatility. Two investments with same CAGR can have very different risk profiles. For volatile investments, also look at Standard Deviation and Sharpe Ratio alongside CAGR.
Calculate CAGR Instantly
Use our free CAGR Calculator to instantly compute the compound annual growth rate of any investment. Just enter your beginning value, ending value, and number of years to get your CAGR percentage.
Real-World CAGR Examples
Nifty 50 Index: 1999 (1000 points) to 2024 (20,000) = 13.4% CAGR over 25 years. Real Estate: Property ₹10L (2000) to ₹80L (2024) = 9.2% CAGR. Gold: ₹5,500/gram (2000) to ₹75,000 (2024) = 16.1% CAGR. Fixed Deposit: ₹1L at 6% for 10 years = ₹1.79L = 6% CAGR. Mutual Fund SIP: ₹5K/month (2010-2025) = ~15% CAGR approximately.
CAGR vs Absolute Returns - Why Timing Matters
Example: Investment A returned 100% over 10 years (7.2% CAGR). Investment B returned 60% over 5 years (10% CAGR). Investment B is MUCH better despite lower absolute return! Another example: Fund A claims ₹1L to ₹5L (400% return).
Fund B claims ₹1L to ₹1.5L (50% return). Without timeline, Fund A seems amazing. But if Fund A took 30 years (5.54% CAGR) and Fund B took 3 years (14% CAGR), Fund B is 2.5x better! Always ask: "What time period?" Then calculate CAGR to compare apples to apples.
CAGR Benchmarks for Indian Investments
Nifty 50: 12-15% CAGR historically (long-term). Large-cap funds: 10-13% CAGR. Mid-cap funds: 12-18% CAGR (more volatile).
FDs: 5.5-6.5% CAGR (fixed). Gold: 7-9% CAGR (inflation hedge). Real estate: 8-12% CAGR.
SIPs: Same as underlying fund, compounded monthly. Benchmarking rule: Equity should beat inflation (6%) + 4-5% real return = target 10-11% minimum. FDs at 6% barely beat inflation - suitable for safety, not wealth creation.
Use CAGR benchmarks to evaluate: Is your ₹5L SIP at 11% CAGR beating expectations? Yes - solid. At 8% CAGR? Below market - time to review fund quality.
CAGR Traps: What CAGR Doesn't Tell You
Trap 1: CAGR hides volatility - Fund A: 20% CAGR but down 40% some years (stressful). Fund B: 12% CAGR with only 15% volatility (sleep well). Same CAGR, different stress! Trap 2: Survivorship bias - Past CAGR only counts funds that survived (failed funds excluded).
Real average is lower. Trap 3: Expense ratio impact - CAGR shown before expenses. Actual investor CAGR = shown CAGR minus fees.
Trap 4: Market conditions - 15% CAGR in bull market (2010-2020) won't repeat. Use historical 20-year CAGR, not recent 5-year. Solution: CAGR is useful for comparing apples-to-apples, but always review: risk (volatility), consistency (outperformance in all years?), and expenses.
CAGR + volatility + fees = true picture.
CAGR Case Studies: Investment Comparisons (Illustrative Examples)
Illustrative Example (hypothetical scenario based on typical Indian borrower profiles). CASE STUDY 1: Investment Comparison - Gold vs Nifty vs FD (20-year period: 2004-2024). Gold: ₹5,500/gram (2004) → ₹75,000/gram (2024) = CAGR 11.2%.
Total investment (₹5.5L): Became ₹82.5L. Real Estate: ₹10L property (2004) → ₹90L (2024) = CAGR 10.1%. FD: ₹10L invested in 1-year FDs rolled over 20 years, averaging 6.5% = ₹35.5L.
Nifty 50: Index at 1,000 points (2004) → 20,000 (2024) = CAGR 13.4%. ₹10L invested through SIP became ₹42L. Winner: Nifty (13.4% CAGR) beaten inflation, real estate, and gold. Lesson: Equity beats inflation + real estate over 20 years.
Illustrative Example (hypothetical scenario based on typical Indian borrower profiles). CASE STUDY 2: Same CAGR, Different Risk - Fund Comparison. Fund A (Small-Cap): 18% CAGR but volatility 38% (lost 45% in 2020 crash, recovered 65% in 2021).
Fund B (Large-Cap): 12% CAGR with volatility 18% (lost 15% in 2020, recovered 22% in 2021). Investor X chose Fund A for higher CAGR. During 2020 crash, panicked at -45% loss, sold at bottom (-45%).
Missed 65% recovery. Final CAGR: 6.2% (half expected). Investor Y chose Fund B for stability.
Continued SIP through crash. Bought more units at low NAV. Post-recovery, final CAGR: 12.8% (matched expectation).
Lesson: CAGR + volatility matters more than CAGR alone. Same 18% CAGR from different paths (smooth vs volatile) have different real-world outcomes. Illustrative Example (hypothetical scenario based on typical Indian borrower profiles).
CASE STUDY 3: Expense Ratio Impact on CAGR. Fund returns before fees: 12% gross. Fund A (Direct): 0.15% expense ratio = 11.85% net CAGR.
Fund B (Regular): 1.5% expense ratio = 10.5% net CAGR. Over 20 years on ₹10L investment, difference = ₹20-25L final corpus! Lesson: Active fund claiming 12% CAGR is actually 10.5-11%. Index fund at 12% is truly 11.85%.
Small fee differences compound over decades. Per SEBI regulations on mutual fund performance disclosure: SEBI mandates that all mutual fund advertisements include standardised performance data over 1-year, 3-year, 5-year, and since-inception periods to prevent cherry-picking of favourable periods. SEBI also requires funds to display Total Expense Ratio (TER) prominently, since a 1% annual fee difference compounds into a significant corpus reduction over 20-30 year holding periods.
Investors are advised to evaluate net-of-expense CAGR and not just gross fund returns. Pro Tips: (1) Check 10-20 year CAGR, not recent years. (2) Compare net CAGR (after fees), not gross. (3) For same CAGR, choose lower volatility. (4) Remember: 12% CAGR nominal = 6% real (after 6% inflation).
Frequently Asked Questions
What is a good CAGR for mutual funds in India?▸
For equity mutual funds in India, a CAGR of 12-15% over 5-10 years is considered good. Large-cap funds typically deliver 10-13% CAGR, while mid/small-cap funds can deliver 14-18% CAGR over long periods.
Is higher CAGR always better?▸
Not necessarily. Higher CAGR often comes with higher risk and volatility. A 20% CAGR small-cap fund may have years of -40% returns, while a 12% CAGR large-cap fund is more stable. Consider risk-adjusted returns (Sharpe ratio) alongside CAGR.
How do I calculate CAGR manually without a calculator?▸
Formula: CAGR = (Ending Value ÷ Beginning Value)^(1 ÷ Number of Years) - 1. Example: Investment grew from ₹10L to ₹50L over 10 years. Step 1: 50L ÷ 10L = 5. Step 2: 5^(1÷10) = 5^0.1 = 1.1746. Step 3: 1.1746 - 1 = 0.1746 = 17.46% CAGR. Using Excel: =POWER(Ending/Beginning, 1/Years)-1. The power function calculates the 10th root automatically. For quick mental math: If money doubled in 10 years = 7.2% CAGR (approximately). If money quadrupled in 10 years = 14.9% CAGR. These benchmarks help you quickly estimate if a fund's CAGR is impressive.
What CAGR should I expect from different investment types?▸
Historical CAGR benchmarks for Indian investors (20-year average): Bank FD: 5-6% CAGR (safest, guaranteed). Gold: 7-9% CAGR (inflation hedge, volatile). Bonds: 6-8% CAGR (government securities, debt funds). Real Estate: 8-12% CAGR (location dependent, illiquid). Large-Cap Stocks/Funds: 10-13% CAGR (medium volatility). Mid-Cap Stocks/Funds: 12-18% CAGR (high volatility). Small-Cap Stocks/Funds: 15-20%+ CAGR (extreme volatility, long-term only). Nifty 50 Index: 12-15% CAGR (market baseline, diversified). Inflation Rate: 6-7% CAGR (erodes purchasing power). Rule of thumb: If investment CAGR < 7%, barely beats inflation. If CAGR 10-12%, solid wealth builder. If CAGR > 15%, exceptional but risky. Choose investments matching your risk tolerance and time horizon, then monitor if they deliver expected CAGR.
What is the difference between CAGR and IRR?▸
CAGR measures growth between two specific points in time (beginning and ending value). IRR (Internal Rate of Return) accounts for irregular cash flows at different time periods. For SIP investments with monthly contributions, IRR (or XIRR in Excel) is more appropriate than CAGR.
How is CAGR different from XIRR?▸
CAGR works for lump sum investments (one beginning value, one ending value). XIRR is used for multiple cash flows at different dates — like monthly SIP investments. When evaluating SIP returns, always use XIRR for accuracy.
Can CAGR be negative?▸
Yes, if the ending value is less than the beginning value, CAGR will be negative. For example, if ₹1 lakh invested in 2020 became ₹80,000 by 2025, CAGR = (80,000/1,00,000)^(1/5) - 1 = -4.3%. This means the investment lost value at 4.3% per year.
Is 12% CAGR realistic for Indian mutual funds?▸
Yes, historical data supports 12% CAGR for equity funds in India. Nifty 50 delivered 14-15% CAGR over past 20 years, large-cap funds 11-13%, mid-cap 14-18%. But note: Past != future. 12% is long-term average, not every year. Expect volatility: Year 1 +30%, Year 2 -15%, Year 3 +8%. Over 20 years, averages to 12%. Conservative planning: Assume 9-10% for conservative, 12% for moderate, 15% for aggressive equity.
How do I compare investments with same CAGR but different volatility?▸
Use Sharpe Ratio = (CAGR - risk-free rate) / Standard Deviation. Measures return per unit of risk. Example: Fund A CAGR 12% with volatility 15%. Fund B CAGR 12% with volatility 25%. Fund A = better (same return, less risk). Practical tip: Same CAGR, pick lower volatility (smaller year-to-year swings, less volatility pain). Our calculator shows CAGR - detailed volatility analysis needs additional data.
What is the relationship between CAGR and compounding?▸
CAGR IS the compounding rate expressed annually. Compounding = earning returns on returns. ₹1L at 12% CAGR for 20 years = ₹9.6L not from 12% x 20 = 240% but from compounding. Year 1: ₹1L x 1.12 = ₹1.12L. Year 2: ₹1.12L x 1.12 = ₹1.254L. Year 20: ₹9.6L earned ₹1M that year alone! Early years earn small amounts, late years earn massive amounts. This exponential growth is the power of CAGR over time.
Related Articles
Try Our Free CAGR Calculator
Get instant, accurate results without any registration required.
Open CAGR Calculator →